YouTube Video: Life on the River
AWARENESS
The Land of Superlatives
Bangladesh is often described as the “land of superlatives”. It is not only one of the most densely populated countries in the world, but is also the confluence of three of the most prolific and powerful rivers on Earth: the Ganges, the Brahmaputra and the Meghna. These rivers, combined as the Padma in the south of Bangladesh, boast an average discharge of 38,129 meters cubed per second, which is rivaled only by the Amazon and the Congo.

Figure 1: Prime Minister’s Office Library, Dhaka. Government of the People’s Republic of Bangladesh.
In addition to water, these mighty rivers carry tons of eroded sediment from the Himalayas to the north, another seldom rivaled geographic feature of our planet. This massive influx of sand, silt, and clay acts as a precarious cushion upon which the Bengali people have built cities, villages, and livelihoods. The lack of solid bedrock for development, compounded by persistent poverty and poorly constructed infrastructure, has left this unique nation incredibly vulnerable to hazards of all kinds. According to the United Nations, Bangladesh experienced 219 natural disasters between 1980 and 2008, resulting in over $16 billion US dollars in damage. At the convergence of the Indian and Eurasian tectonic plates, Bangladesh is particularly exposed to the threat of earthquakes as well as the persistent flooding posed by its dynamic fluid systems. Bangladesh is also considered to be the most vulnerable country in the world to tropical cyclones:

Figure 2: United Nations Development Programme, 2004.
Compounding these daunting challenges, 25% of Bangladesh’s land area is under 1 meter above sea level, and half is below 6. This is very troubling considering that the Intergovernmental Panel on Climate Change (IPCC) predicted conservatively that our planet will experience approximately a meter of sea level rise by 2100. This would put millions of people in Bangladesh underwater and without homes. The global political implications of accommodating this many environmental refugees are staggering.

Figure 3: Socioeconomic Data and Applications Center, NASA.2009.
Bangladesh is not alone in this struggle. A study released by the Institute for Demographic Research at the City University of New York calculated that 634 million people globally live 10 meters or less above sea level. Therefore, Bangladesh has been considered a priority site for understanding and strategizing potential mitigation tactics for the many compounding concerns associated with climate change. In this way, it can be considered a case study for many coastal regions worldwide. As an impoverished nation, if Bangladesh can uncover economically feasible solutions to its problems, they can be extrapolated across the globe and tailored to nations varying in wealth and political status.
UNDERSTANDING
Waters of Life and Death
Bangladesh has always been home to both channelized and sometimes unrestricted waters. The seasonal monsoons, which flood the landscape with water, have been a source of nutrient rich mud on which to plant rice. There are two types of floods in Bangladesh: the barsha, which are annual floods that inundate 20% of the land area, and bonna, which are less common or predictable, and affect more than 35% of the area. For the most part, the Bengali people have adapted to regular floods, many living on houseboats or in stilted houses for a portion of the year. However, the flooding that has been a source of life for generations is quickly becoming a force of destruction. The area affected by bonna floods has increased from 35% in 1974 to 68% in 1998. It is becoming clear that the strategies that once were sufficient for survival here must be adapted for floods that are more frequent, more intense, and longer lasting than those of the past.
Many factors have contributed to this troubling increase in flooding, most related to human activity. Increasing urbanization has fundamentally changed the character of the Bengali landscape. From 1951 to 1990, the urban population increased from 1.81 million (4.33% of total population) to 25.2 million. Currently, approximately 25% of the population resides in cities. In order to accommodate this influx, rapid development has proceeded, dramatically increasing the amount of impervious surfaces in a once predominantly rural nation. It is well known that impervious surfaces, such as parking lots and roads, prevent rainwater from infiltrating the soil, forcing this water to concentrate and run off into waterways. Instead of nourishing vegetation, this water, now full of pollutants such as motor oil, has no path to travel except directly into rivers that swell correspondingly. It is recommended by the United States Geological Survey that every 10% increase in impervious surface added to a watershed be met with a 23% increase in drainage capacity, typically achieved by dredging or deepening stream channels. This has not been undertaken.
It is not just the activities within national boundaries that contribute to flooding downstream. Agriculture has intensified in India to the north, as well as along the slopes of the Himalayas in Nepal. This agriculture has damaged many of the riparian buffer zones along river channels and greatly increased soil erosion. This works in conjunction with active deforestation. Only 10% of Bangladesh is still forested.
Life on a Char
The social and political aspects of flooding in Bangladesh are complex. It is important to understand that rivers are not static features. In fact, they are constantly avulsing across the landscape, occupying new channels while leaving older ones dry. They scour their banks in some places while accreting sediment in others. In some ways, rivers can be considered alive. While this is a fascinating geological concept, it creates real problems in developing lasting human structures. Unfortunately, as rivers are a vital passage for trade and commerce in Bangladesh, it is essential to build in proximity to them. In fact, rivers are so numerous here that it would be nearly impossible to build far from them, even with concerted effort. The poor are most often encumbered by this challenge. The International Fund for Agricultural Development estimates that 26,000 Bengalis per year lose their land due to mercurial river dynamics. Many of these people, unexpectedly evicted from their homes, choose to take up residence on chars, newly accreted land formed by deposition of riverine sediment. Chars can be either island chars or attached chars. Island chars are inaccessible from the mainland year round, whereas attached chars are generally accessible except in periods of high flow, when usually abandoned river channels are filled. Island chars tend to be older and more stable. Flooding over chars leaves behind a layer of fine clay and silt, conducive to the growth of vegetation.

Figure 4: Rahman et al, Char Formation and Livelihood Characteristics of Char Dwellers of Alluvial River in Bangladesh. 2012.
Unfortunately, persons who lose their land due to the river have no legal entitlement to compensation. Furthermore, any newly built land, such as chars, becomes property of the government. Families must petition the government for portions of this land, often after much time and struggle.
Life on a char is not easy, although it is the reality for an estimated 5 million Bengalis today. Access to basic amenities, such as medical care, sanitation, electricity, and schools is severely limited if not entirely absent. 44% of char dwellers lost crops in the floods of the 2002 monsoon season, as compared to only 1% of rural Bengalis. This fosters financial insecurity—some households are forced to take out loans just to buy staple foods such as rice, which do not provide the essential micronutrients that expensive animal products can provide. Efforts have been made by the Bengali government and many international aid organizations such as the World Bank to mitigate the damaging effects of flooding, in order to promote an improved quality of life for both char dwellers and the population at large.
ANALYSIS
The Flood Action Plan
Several action plans have been written, approved, and implemented to address these issues over the past couple decades. Following a particularly nasty flood season in 1988, the Government of Bangladesh adopted a World Bank sponsored Flood Action Plan (FAP), which called for many technical engineered solutions. The goals of FAP were to protect rural infrastructure, increase flood awareness and education, produce structures and protective embankments, create a flood forecasting system, and increase global awareness of floods and relief needs. 15 donors contributed funds to FAP, but it was met with harsh criticism as being unrealistic and impractical. Initial cost estimates anticipated $155 billion was necessary to simply construct protective infrastructure, with an additional $5-$10 billion to maintain it. While some of the advocated structures were actually built, many were out of the realm of feasibility.
There were also unintended consequences of FAP. Natural flooding of the river historically contributed to soil fertility, and also was a crucial step in the life cycle of many fish populations. Yield from both fishermen and farmers was adversely affected. FAP was abandoned as investors harbored concerns that such a poor country would not be able to afford maintenance of embankments even if they were found to be entirely successful.
Engineered Solutions
One technical strategy that has been implemented across the nation is “falling aprons”. These protective measures are fairly simple in design: large concrete blocks called “rip rap” are placed along the banks of the river. When scouring occurs, the rip rap falls down and piles along the eroding bank, fortifying it. Instead of concrete blocks, sometimes sand filled textile bags called geobags are used.

Figure 5: Dr. Mark E. Vardy, National Environmental Research Council. 2015.
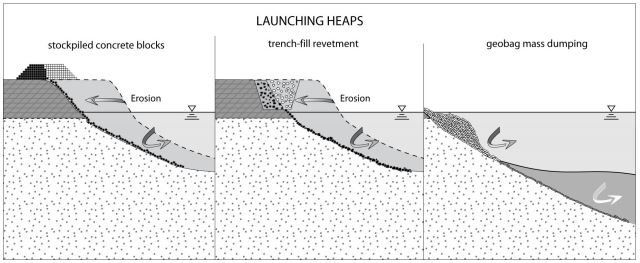
Figure 6: Oberhagemann et al, Understanding Falling Aprons-Experience from the lower Brahmaputra/Jamuna River, 2008.
Flood control measures in Bangladesh have been largely limited to earthen embankments and polders. The Bangladesh Water Development Board has constructed a total of 5,695 kilometers of embankments to date. An embankment is simply a ridge built generally out of earth or rock to raise the elevation around a river so that flood waters are contained and do not spill out onto the landscape. The Mississippi River in the United States also boasts several of these structures, but also has much greater financial means to both build and maintain them. Embankments can provide some short-term relief, but they must be continually maintained. More importantly, they deny the very nature of the river as a dynamic feature that cannot be restricted to its channel alone. The floodplain is an inherent component of the river, and by denying the river its ability to flood we only serve to decrease drainage capacity and ultimately intensify the effects of flooding.
The Char Development and Settlement Project
While the complexity of physical and technical solutions continues to challenge scientists, there has been moderately better success in social development initiatives. The Char Development and Settlement Project (CDSP) was launched in 1994, with the purpose of facilitating approval for displaced persons seeking land from the government. The first step in this process is Plot-to-Plot Surveying (PTPS). Cartographers measure each plot of land on a char and also collect census data on the inhabitants of each. Once maps are compiled, they are published and the public is given 30 days to express complaints or make changes. In most land based proceedings, these maps are posted at the Upazila Land Office. However, this requires that people who have limited means to travel may not be able to make the journey to the office. What is innovative about CDSP is that the maps get posted at the village level, easily accessible to all people. Those families that are listed as officially landless are put into a streamlined process to be approved for their own property. The government taking an active role in this land distribution has also protected vulnerable people from abuse by the Bahini, once a military group fighting Pakistan in the 1970s, but now functionally a gang wielding considerable local power. In the absence of federal level enforcement, they have been the primary source of selling land, but often intimidate and exploit those who purchase.
Another new and progressive aspect of the CDSP is that it is far more aware of gender empowerment than previous policies. Women are listed as equal owners of land with their husbands in legal documentation. They have legal ownership of 50% of the land. Therefore, if a husband is implicated in abuse or criminal activity, he can lose his share of the land at no detriment to his wife. As of now, this initiative has only been undertaken on five chars, but it is intended to be expanded in coming years. By 2017, 28,000 households are anticipated to benefit from the services included in the CDSP.
The Bangladesh Climate Change Strategy and Action Plan
The government of Bangladesh is not blind to the fact that their nation is one of the most vulnerable on Earth. In 2009, they drafted the Bangladesh Climate Change Strategy and Action Plan. This was built on six pillars:
Food Security, Social Protection, and Health: Access to employment, safe housing, medical services, and sufficient food for the most vulnerable populations.
Comprehensive Disaster Management: Further improve the country’s disaster management systems.
Infrastructure: Keeping key infrastructure, such as embankments and cyclone shelters, well maintained and prepped for unexpected emergencies.
Research and Knowledge Management: Predicting the scale and timing of climate change impacts and determine appropriate investments for future mitigation.
Mitigation and Low Carbon Development: To develop more low carbon strategies in the nation’s businesses and institutions
Capacity Building and Institutions: To strengthen the ability of the federal government to manage effectively in disaster scenarios.
This Action Plan has many smart components. First, it is important to acknowledge that the question of climate resilience is not simply an environmental and technical problem. These inevitable physical threats will be compounded by the underlying social vulnerabilities and poverty experienced by a large portion of the nation. Simply providing amenities to these people during times of flooding or no is essential. This social inequality aspect was one of the reasons Hurricane Katrina in New Orleans was so catastrophic. It is not only the job of engineers to solve all problems with technology—the social ills and world wealth discrepancies must be addressed. It is also wise that Bangladesh is keen to collaborate with other world partners. This will allow them to fund more ambitious projects, which has been one of the greatest hindrances to their resiliency success as of now. Although climate resistant infrastructure is more costly to construct, in the long term their costs will be minimal in comparison to repairing damage that has been done.
STRATEGIES
The Role of the Planner
It is clear that the harmful effects of climate change have begun to wage their war against Bangladesh, and that these effects will only intensify in the coming years. We must be realistic in determining how much we can really do to prevent flooding in a place where flooding has been a natural process for thousands of years. Rather than attempting to fundamentally alter nature to be more convenient for human activity, it is human behavior that must be manipulated.
Urban and regional planners have an important role to play in the coming years. First of all, urbanization needs to be more carefully planned. All development this nation has needs to be framed around the immutable desires of the river. The technology for pervious paving is still nascent, but could be crucial to increasing drainage of floodwaters to reduce devastating runoff. If pervious surfaces are not an option, urbanization should be restricted to areas with underlying silty or clay soils. Water can much more easily drain through sand, so sandy areas should be left exposed to increase infiltration. Certain vegetation could also be planted that increases drainage area for water—conveniently, the staple food item of Bangladesh, rice, thrives under flooded conditions.
The Government of Bangladesh should identify which floodplain areas are the most prone to flooding. This can be achieved by researching historical flood data over the past century to determine which places most commonly experienced damaging floods. With a floodplain zoning plan, key infrastructure and amenities such as hospitals, condensed housing, and schools can be built elsewhere. Undeveloped floodplains allow the river to naturally flood while incurring fewer damages to human life and structures. To continually rebuild in a region that will always be flooded again is to fight a battle that cannot be won.
The financial situation of Bangladesh makes comprehensive planning difficult or impossible for them to achieve. Therefore, lessons must be taken from the incremental planning school of thought. Rather than building huge stretches of embankments all at once, with little idea of their efficacy, it may be more appropriate to experiment with different designs temporarily. Because flooding is so frequent, experimental structures can be tested quickly and adapted in steps, with far less financial commitment. Homes built on stilts have been moderately successful—an expansion of this practice, at least in the less earthquake prone regions, could spare some flood damage. Bangladesh could certainly learn lessons from other coastal regions, such as the United States Gulf Coast. Sharing of ideas and collaboration internationally could be beneficial to all parties. Climate change and sea level rise are threats to all humanity, not just isolated countries.
Behavior Change and Social Action
Again, the challenges of flooding and climate change are shaped in part by our social institutions. The Government of Bangladesh must prioritize creating financial stability for its most socially vulnerable groups. The Char Development and Settlement Project is a good first step in this effort.
Education will also be a big player in how Bangladesh responds to its many environmental hazards. Farmers in both Bangladesh as well as northern India could work to adopt better management practices, such as conservation tilling, to minimize soil erosion. Training programs could help farmers to not only produce crops more efficiently, but also to decrease their effects on the greater environment. More broadly, an expansion of family planning education and birth control accessibility could slow the rapid growth of the Bengali population. The population density here is already too great to be managed well—resources do not exist to accommodate unsustainable growth.
Unfortunately, the problems that Bangladesh faces will not remain theirs alone to shoulder. Projected sea level rise makes it likely that no matter how resilient Bangladesh becomes, it may still face destruction. The nations of the world need to become cognizant of the role they may play in future decades. It is an important philosophical, moral, and logistical question to see how environmental refugees will be sheltered when their homes are permanently underwater. It is only with a strong and unified international movement that we will be able to overcome the challenges the future holds, for Bangladesh and for us all.
References:
“Bangladesh: Disaster Risk Reduction As Development”. United Nations Development Programme. N.p., 2016. Web. 2 May 2016.
Brammer, Hugh. “After The Bangladesh Flood Action Plan: Looking To The Future”. Environmental Hazards 9.1 (2010): 118-130. Web.
Greenfieldboyce, Nell. “Study: 634 Million People At Risk From Rising Seas”. NPR.org. N.p., 2007. Web. 2 May 2016.
Hausfather, Zeke. “IPCC’s New Estimates For Increased Sea-Level Rise – Yale Climate Connections”.Yale Climate Connections. N.p., 2013. Web. 2 May 2016.
Hessel, Sarah. “Living On New Land: Char Development In Bangladesh”. International Fund for Agricultural Development. N.p., 2013. Web. 2 May 2016.
Khalequzzaman, Md. “Flood Control In Bangladesh Through Best Management Practices”. Georgia Southwestern State University (2016): n. pag. Web. 2 May 2016.
“LEDC Case Study: Coping With Flooding In Bangladesh”. British Broadcasting Company. N.p., 2016. Web. 2 May 2016.
“Life In The Chars In Bangladesh”. Nutritional Surveillance Project Bulletin 14 (2003): n. pag. Web. 2 May 2016.
Ministry of Environment and Forests, Government of the People’s Republic of Bangladesh,. Bangladesh Climate Change Strategy And Action Plan 2009. Dhaka, Bangladesh: N.p., 2009. Web. 2 May 2016.
Netherlands Development Cooperation,. Flood Action Plan, Bangladesh. 1993. Web. 2 May 2016.
Oberhageman, Knut, Philemon Diggelmann, and Mukhles-Uz-Zaman. “Understanding Falling Aprons– Experience From The Lower Brahmaputra/Jamuna River”. Fourth International Conference on Scour and Erosion (2008): 302-309. Web. 2 May 2016.
Rahman, M. R. and Chowdhury, J. U., 1998, Impacts of flood control projects in Bangladesh. In, Ali, M. A., Hoque, M. M., Rahman, R., and Rashid, S., 1998 (eds), Bangladesh Floods – Views from Home and Abroad: Dhaka, United Press Limited, p. 55-66.
Rahman, Mohammad Arifur and Md. Munsur Rahman. “Char Formation And Livelihood Characteristics Of Char Dwellers Of Alluvial River In Bangladesh”. 6th International Conference on Scour and Erosion (2012): 145-152. Web. 2 May 2016.
“Socioeconomic Data And Applications Center | SEDAC”. Sedac.ciesin.columbia.edu. N.p., 2016. Web. 2 May 2016.
“The Char Development And Settlement Project Phase IV”. Cdsp.org.bd. N.p., 2015. Web. 2 May 2016.
United States Geological Survey,. Flood Characteristics Of Urban Watersheds In The United States. Alexandria, Virginia: N.p., 1984. Web. 2 May 2016.
“Water Resources Of India”. Current Science 89.5 (2005): 794-811. Web. 2 May 2016.